
User Instructions for Shelf Life Calculator
Shelf Life Calculator enables you to predict or evaluate the remaining storage life
of fresh produce under specific environmental conditions.
It offers two main modes of operation:
- Predict: Manually enter your storage parameters to simulate shelf life.
- Evaluate: Upload real-time storage data files for automatic evaluation.
The system uses a scientifically validated quality decay model combined with a database of
product-specific parameters for over 250 products to estimate quality loss,
storage risks, and shelf life under given conditions.
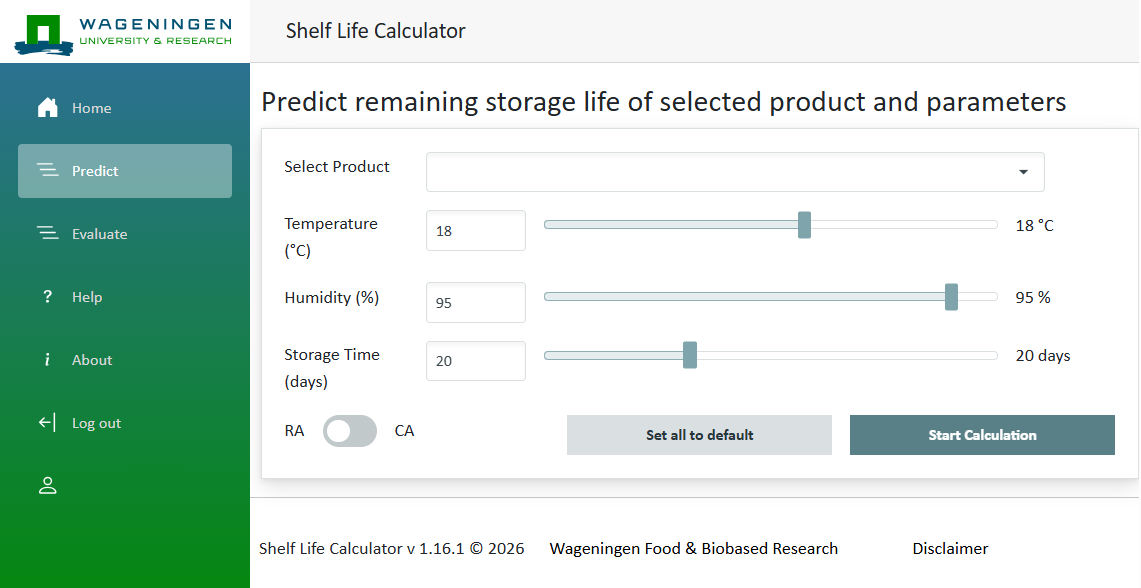
1. Predict Mode
Use the Predict tab to manually enter input parameters and simulate the remaining storage life of your product.
Step-by-Step Instructions:
- Select Product
Choose the product species from the dropdown list. You may also select a cultivar if available. - Enter Storage Conditions
Manually fill in the following fields:- Temperature (°C): Set the desired storage temperature.
- Humidity (%): Input the relative humidity.
- Storage Time (days): Enter the intended storage duration.
- Use RA (Regular Atmosphere) – standard air composition.
- Use CA (Controlled Atmosphere) – controlled oxygen and carbon dioxide levels.
- Set All to Default
Resets all parameters to their default values. - Start Calculation
Click Start Calculation to run the ShelfLifeCalculator model.
The model uses your input to calculate the remaining storage life,
simulate quality changes over time, and identify potential storage risks. - Output includes:
- Remaining storage life (days)
- Alarms when quality thresholds are exceeded
- Graphs of temperature, humidity, and gas concentrations over time
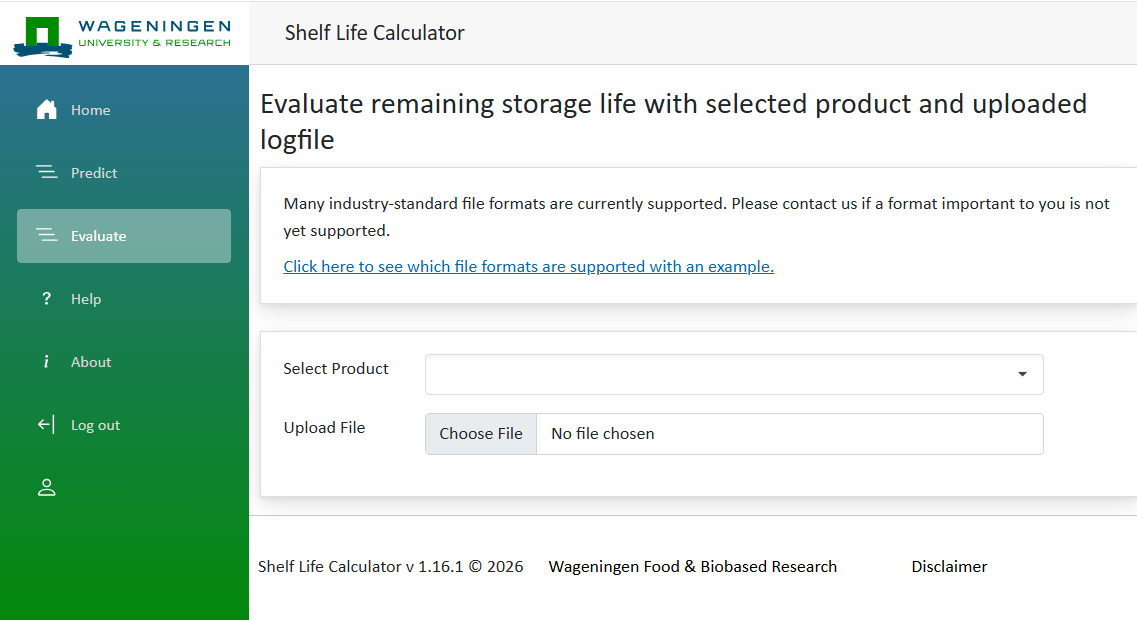
2. Evaluate Mode
Use the Evaluate tab to assess the remaining storage life using real-world data logs from temperature or atmosphere recorders.
Step-by-Step Instructions
- Select Product
Choose the relevant product from the dropdown list. - Upload File
Click Upload File and select your data file. Supported file formats include:- Captain Peter (Maersk)
- Frigga
- SensiWatch
- tagreport
- Tive-Report
- XSense
- and various CSV file formats
- Start Evaluation
Once uploaded, Shelf Life Calculator reads your log data, applies the same model used in Predict mode, and computes the evaluated remaining storage life. - Output includes:
- Remaining storage life (days)
- Alarms when quality thresholds are exceeded
- Graphs of temperature, humidity, and gas concentrations over time
Understanding the Output
Once the calculation is complete, the system presents both numerical and graphical results.
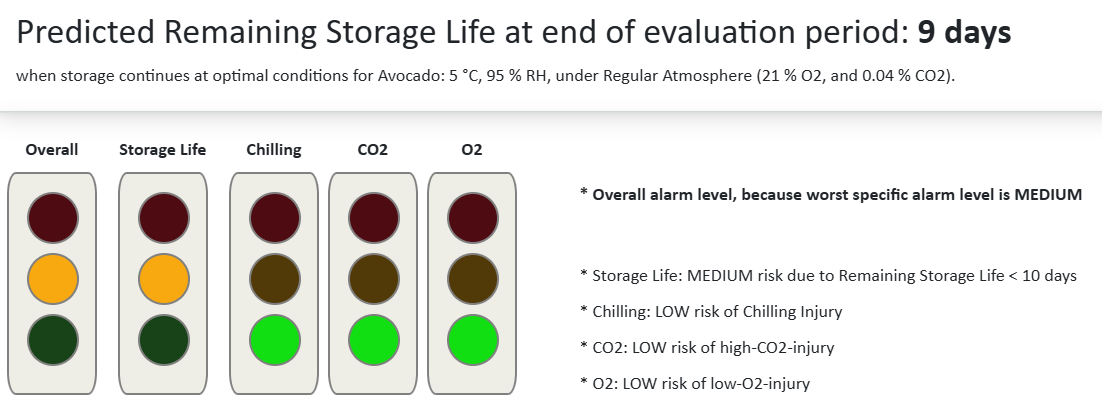
Calculated Remaining Storage Life
Displayed at the top, this value (e.g., 1 day) indicates how long the product can be safely stored under optimal temperature at regular atmosphere before quality becomes unacceptable.
Overall Condition Summary
A traffic light system and a risk summary are shown, highlighting the overall quality status, specific risk factors, and product safety under the given conditions.
| Trait | Risk Level | |
|---|---|---|
| Overall | : | The overall alarm level. Reflects the worst specific alarm level. |
| Storage Life | : | Indicates risk of quality loss based on remaining storage life |
| Chilling | : | Risk of chilling injury |
| CO₂ | : | Risk of high-CO₂ injury |
| O₂ | : | Risk of low-oxygen injury |
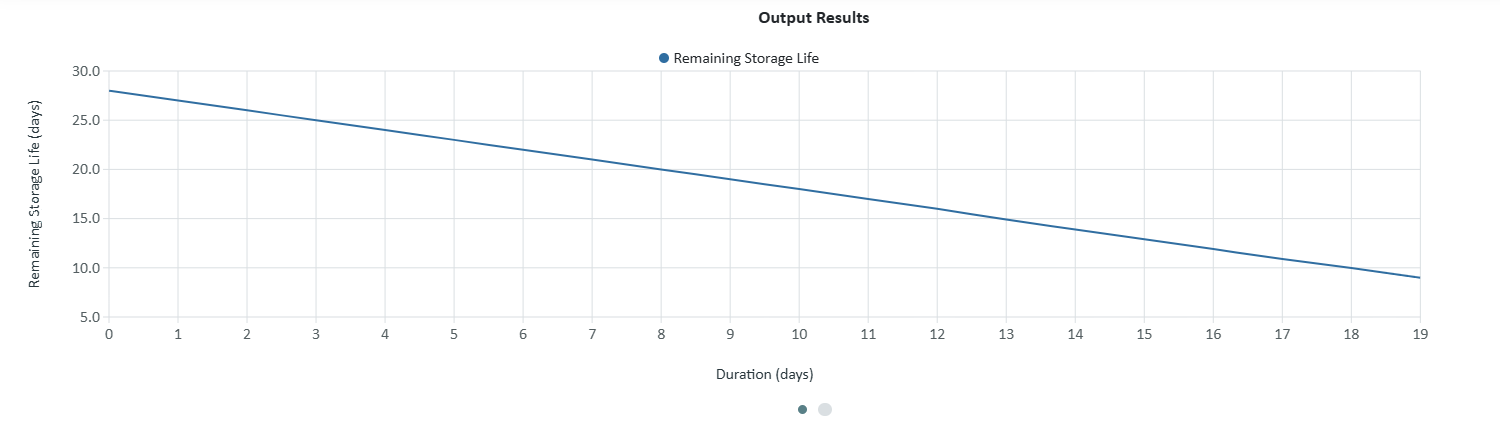
Graphs and Visual Results
Below the summary, several graphs visualise quality decay and environmental trends over time.
- Temperature Profile: Displays temperature (°C) variations during storage and identifies chilling thresholds.
- Humidity Profile: Shows changes in relative humidity over the storage period.
- Remaining Storage Life: Illustrates the predicted decline in remaining shelf life over time.
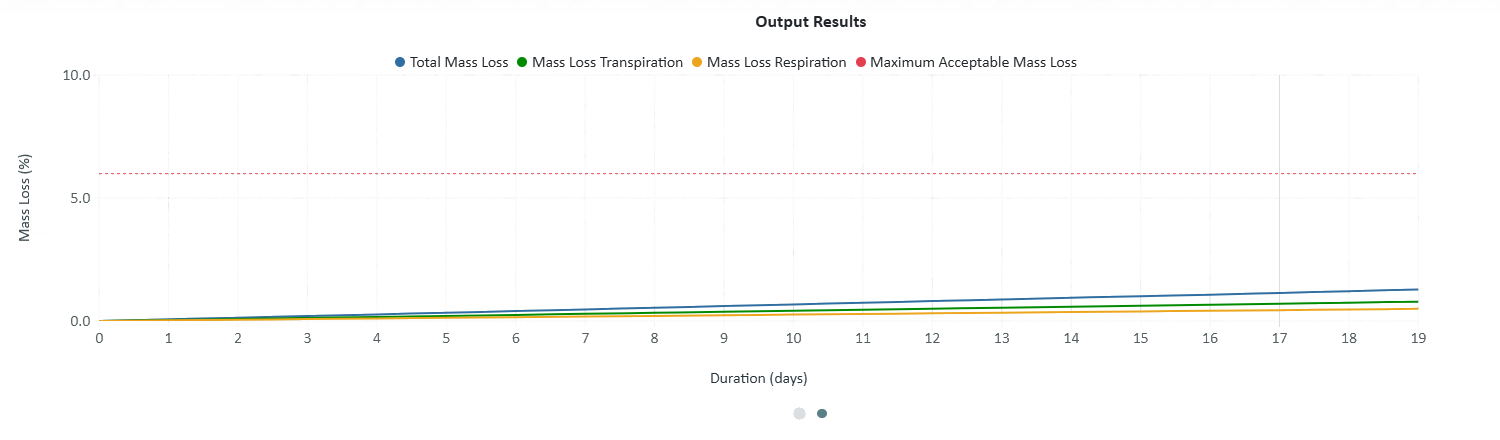
- Total Mass Loss (%): Depicts weight loss progression, reflecting respiration and transpiration effects.
- Temperature and Chilling Temperature: This graph displays both the actual temperature (°C) profile and the chilling temperature threshold over time.
Each graph can be navigated using the scrolling buttons (OOO) to review different variables across the same time period.
Software Version
At the bottom of the results section, the current software version (e.g., v13.0.8) is displayed for reference.
Understanding the Model
Shelf-Life-Calculator combines a broad quality decay model with product-specific parameters from its internal database.
The model accounts for key predictive-quality traits, such as:- Ageing and ripening
- Weight loss
- Chilling/freezing injury
- Low-oxygen injury
- High-carbon-dioxide injury
It also integrates respiration and transpiration processes to calculate realistic shelf-life estimates. Remaining storage life represents how long a product can be stored at its optimal temperature (Topt) in a regular atmosphere before quality becomes unacceptable.
Technical Background
The Shelf-Life-Calculator web interface operates as a user-friendly front end connected to a powerful API and product database:- The API implements the generic quality decay model.
- The database provides the parameters for each product.
- The interface enables manual input, file upload, and graphical visualisation.
To integrate the API directly into your system, please contact us for access details.
Future Improvements and Extensions
Shelf-Life-Calculator is under continuous development.
Planned updates include:- Improved prediction accuracy
- New product entries in the database
- Additional supported file formats and export options
We welcome your feedback, which helps us enhance performance and expand features. Please write us to: PostHarvest Consultancy.